
“We have charts and graphs to back us up. So f*** off.” New hires in Google’s people analytics department began receiving a laptop sticker with that slogan a few years ago, when the group probably felt it needed to defend its work. Back then people analytics—using statistical insights from employee data to make talent management decisions—was still a provocative idea with plenty of skeptics who feared it might lead companies to reduce individuals to numbers. HR collected data on workers, but the notion that it could be actively mined to understand and manage them was novel—and suspect.
Today there’s no need for stickers. More than 70% of companies now say they consider people analytics to be a high priority. The field even has celebrated case studies, like Google’s Project Oxygen, which uncovered the practices of the tech giant’s best managers and then used them in coaching sessions to improve the work of low performers. Other examples, such as Dell’s experiments with increasing the success of its sales force, also point to the power of people analytics.
But hype, as it often does, has outpaced reality. The truth is, people analytics has made only modest progress over the past decade. A survey by Tata Consultancy Services found that just 5% of big-data investments go to HR, the group that typically manages people analytics. And a recent study by Deloitte showed that although people analytics has become mainstream, only 9% of companies believe they have a good understanding of which talent dimensions drive performance in their organizations.
What gives? If, as the sticker says, people analytics teams have charts and graphs to back them up, why haven’t results followed? We believe it’s because most rely on a narrow approach to data analysis: They use data only about individual people, when data about the interplay among people is equally or more important.
People’s interactions are the focus of an emerging discipline we call relational analytics. By incorporating it into their people analytics strategies, companies can better identify employees who are capable of helping them achieve their goals, whether for increased innovation, influence, or efficiency. Firms will also gain insight into which key players they can’t afford to lose and where silos exist in their organizations.
Most people analytics teams rely on a narrow approach to data analysis.
Fortunately, the raw material for relational analytics already exists in companies. It’s the data created by e-mail exchanges, chats, and file transfers—the digital exhaust of a company. By mining it, firms can build good relational analytics models.
In this article we present a framework for understanding and applying relational analytics. And we have the charts and graphs to back us up.
Relational Analytics: A Deeper Definition
To date, people analytics has focused mostly on employee attribute data, of which there are two kinds:
- Trait: facts about individuals that don’t change, such as ethnicity, gender, and work history.
- State: facts about individuals that do change, such as age, education level, company tenure, value of received bonuses, commute distance, and days absent.
The two types of data are often aggregated to identify group characteristics, such as ethnic makeup, gender diversity, and average compensation.
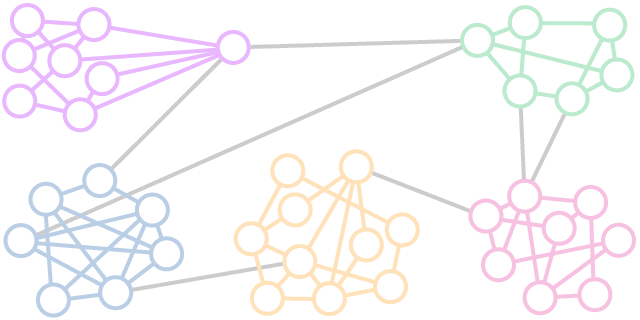
Attribute analytics is necessary but not sufficient. Aggregate attribute data may seem like relational data because it involves more than one person, but it’s not. Relational data captures, for example, the communications between two people in different departments in a day. In short, relational analytics is the science of human social networks.
Decades of research convincingly show that the relationships employees have with one another—together with their individual attributes—can explain their workplace performance. The key is finding “structural signatures”: patterns in the data that correlate to some form of good (or bad) performance. Just as neurologists can identify structural signatures in the brain’s networks that predict bipolar disorder and schizophrenia, and chemists can look at the structural signatures of a liquid and predict its kinetic fragility, organizational leaders can look at structural signatures in their companies’ social networks and predict how, say, creative or effective individual employees, teams, or the organization as a whole will be.
The Six Signatures of Relational Analytics
Drawing from our own research and our consulting work with companies, as well as from a large body of other scholars’ research, we have identified six structural signatures that should form the bedrock of any relational analytics strategy.
Let’s look at each one in turn.
Ideation
Most companies try to identify people who are good at ideation by examining attributes like educational background, experience, personality, and native intelligence. Those things are important, but they don’t help us see people’s access to information from others or the diversity of their sources of information—both of which are arguably even more important. Good idea generators often synthesize information from one team with information from another to develop a new product concept. Or they use a solution created in one division to solve a problem in another. In other words, they occupy a brokerage position in networks.
Ideation Signature
Focus: Individual
Predicts: Which employees will come up with good ideas
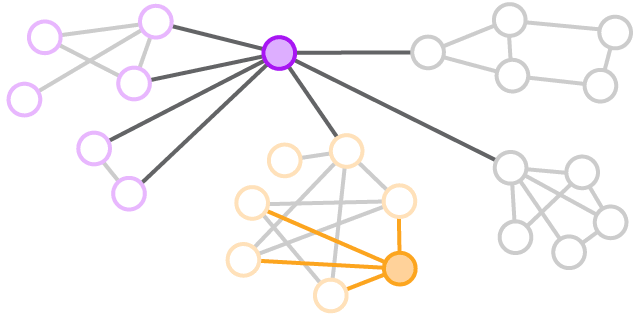
Purple shows low constraint: He communicates with people in several other networks besides his own, which makes him more likely to get novel information that will lead to good ideas. Orange, who communicates only with people within his network, is less likely to generate ideas, even though he may be creative.
The sociologist Ronald Burt has developed a measure that indicates whether someone is in a brokerage position. Known as constraint, it captures how limited a person is when gathering unique information. Study after study, across populations as diverse as bankers, lawyers, analysts, engineers, and software developers, has shown that employees with low constraint—who aren’t bound by a small, tight network of people—are more likely to generate ideas that management views as novel and useful.
In one study, Burt followed the senior leaders at a large U.S. electronics company as they applied relational analytics to determine which of 600-plus supply chain managers were most likely to develop ideas that improved efficiency. They used a survey to solicit such ideas from the managers and at the same time gather information on their networks. Senior executives then scored each of the submitted ideas for their novelty and potential value.
The only attribute that remotely predicted whether an individual would generate a valuable idea was seniority at the company, and its correlation wasn’t strong. Using the ideation signature—low constraint—was far more powerful: Supply chain managers who exhibited it in their networks were significantly more likely to generate good ideas than managers with high constraint.
A study Paul did at a large software development company bolsters this finding. The company’s R&D department was a “caveman world.” Though it employed more than 100 engineers, on average each one talked to only five other people. And those five people typically talked only to one another. Their contact with other “caves” was limited.
Such high-constraint networks are quite common in organizations, especially those that do specialized work. But that doesn’t mean low-constraint individuals aren’t hiding in plain sight. At the software company, relational analytics was able to pinpoint a few engineers who did span multiple networks. Management then generated a plan for encouraging them to do what they were naturally inclined to, and soon saw a significant increase in both the quantity—and quality—of ideas they proposed for product improvements.
Influence
Developing a good idea is no guarantee that people will use it. Similarly, just because an executive issues a decree for change, that doesn’t mean employees will carry it out. Getting ideas implemented requires influence.
Influence Signature
Focus: Individual
Predicts: Which employees will change others’ behavior
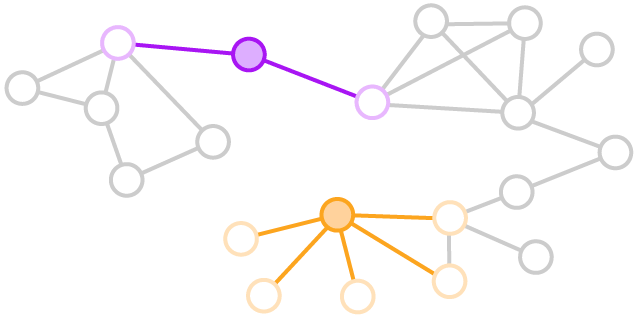
Though she connects to only two people, purple is more influential than orange, because purple’s connections are better connected. Purple shows higher aggregate prominence. Orange may spread ideas faster, but purple can spread ideas further because her connections are more influential.
But influence doesn’t work the way we might assume. Research shows that employees are not most influenced, positively or negatively, by the company’s senior leadership. Rather, it’s people in less formal roles who sway them the most.
If that’s the case, executives should just identify the popular employees and have them persuade their coworkers to get on board with new initiatives, right? Wrong.
A large medical device manufacturer that Paul worked with tried that approach when it was launching new compliance policies. Hoping to spread positive perceptions about them, the change management team shared the policies’ virtues with the workers who had been rated influential by the highest number of colleagues. But six months later employees still weren’t following the new procedures.
Why? A counterintuitive insight from relational analytics offers the explanation: Employees cited as influential by a large number of colleagues aren’t always the most influential people. Rather, the greatest influencers are people who have strong connections to others, even if only to a few people. Moreover, their strong connections in turn have strong connections of their own with other people. This means influencers’ ideas can spread further.
The structural signature of influence is called aggregate prominence, and it’s computed by measuring how well a person’s connections are connected, and how well the connections’ connections are connected. (A similar logic is used by search engines to rank-order search results.)
Employees are not most influenced by the company’s senior leadership.
In each of nine divisions at the medical device manufacturer, relational analytics identified the five individuals who had the highest aggregate prominence scores. The company asked for their thoughts on the new policies. About three-quarters viewed them favorably. The firm provided facts that would allay fears of the change to them as well as to the influencers who didn’t like the policies—and then waited for the results.
Six months later more than 75% of the employees in those nine divisions had adopted the new compliance policies. In contrast, only 15% of employees had adopted them in the remaining seven affected divisions, where relational analytics had not been applied.
Efficiency
Staffing a team that will get work done efficiently seems as if it should be simple. Just tap the people who have the best relevant skills.
Efficiency Signature
Focus: Team
Predicts: Which teams will complete projects on time
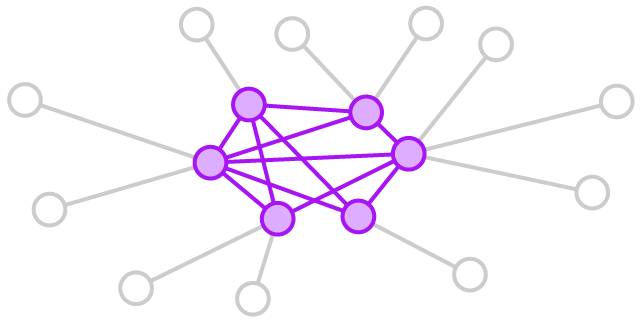
The purple team members are deeply connected with one another—showing high internal density. This indicates that they work well together. And because members’ external connections don’t overlap, the team has high external range, which gives it greater access to helpful outside resources.
Attribute analytics can help identify skilled people, but it won’t ensure that the work gets done on time. For that, you need relational analytics measuring team chemistry and the ability to draw on outside information and expertise.
Consider the findings of a study by Ray Reagans, Ezra Zuckerman, and Bill McEvily, which analyzed more than 1,500 project teams at a major U.S. contract R&D firm. Hypothesizing that the ability to access a wide range of information, perspectives, and resources would improve team performance, the researchers compared the effect of demographic diversity on teams’ results with the effect of team members’ social networks. One issue was that diversity at the firm had only two real variables, tenure and function. (The other variables—race, gender, and education—were consolidated within functions.) Nevertheless, the results showed that diversity in those two areas had little impact on performance.
A slight increase in internal density and external range would save 2,200 hours.
Turning to the relational data, though, offered better insight. The researchers found that two social variables were associated with higher performance. The first was internal density, the amount of interaction and interconnectedness among team members. High internal density is critical for building trust, taking risks, and reaching agreement on important issues. The second was the external range of team members’ contacts. On a team that has high external range, each member can reach outside the team to experts who are distinct from the contacts of other members. That makes the team better able to source vital information and secure resources it needs to meet deadlines. The structural signature for efficient teams is therefore high internal density plus high external range.
At the R&D firm the teams that had this signature completed projects much faster than teams that did not. The researchers estimated that if 30% of project teams at the firm had internal density and external range just one standard deviation above the mean, it would save more than 2,200 labor hours in 17 days—the equivalent of completing nearly 200 additional projects.
Innovation
Teams with the efficiency signature would most likely fail as innovation units, which benefit from some disagreement and strife.
Innovation Signature
Focus: Team
Predicts: Which teams will innovate effectively
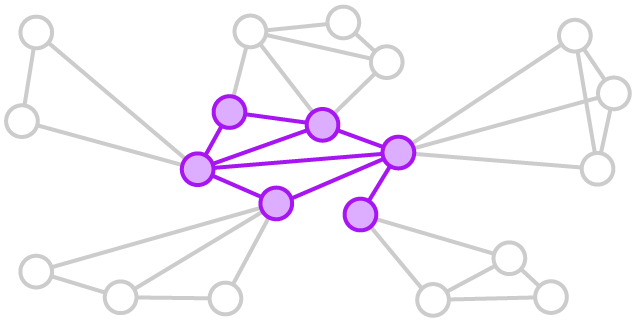
Purple team members aren’t deeply interconnected; their team has low internal density. This suggests they’ll have different perspectives and more-productive debates. The members also have high external range, or wide, diverse connections, which will help them gain buy-in for their innovations.
What else makes for a successful team of innovators? You might think that putting your highest-performing employees together would produce the best results, but research suggests that it might have negative effects on performance. And while the conventional wisdom is that teams are more creative when they comprise members with different points of view, research also indicates that demographic diversity is not a good predictor of team innovation success. In our experience, even staffing an innovation team with ideators often produces no better than average performance.
But if you turn to relational analytics, you can use the same variables you use for team efficiency—internal density and external range—to create promising innovation teams. The formula is a bit different, though: The innovation signature is high external range and low internal density. That is, you still want team members with wide, nonoverlapping social networks (influential ones, if possible) to source diverse ideas and information. But you do not want a tight-knit team.
Why? Greater interaction within a team results in similar ways of thinking and less discord. That’s good for efficiency but not for innovation. The most innovative teams have disagreements and discussion—sometimes even conflict—that generate the creative friction necessary to produce breakthroughs.
The high external range is needed not just to bring in ideas but also to garner support and buy-in. Innovation teams have to finance, build, and sell their ideas, so well-connected external contacts who become the teams’ champions can have a big impact on their success.
For several years, Paul worked with a large U.S.-based automobile company that was trying to improve its product-development process. Each of its global product-development centers had a team of subject-matter experts focused on that challenge. The program leader noted, “We are very careful about who we select. We get the people with the right functional backgrounds, who have consistently done innovative work, and we make sure there is a mix of them from different backgrounds and that they are different ages.” In other words, the centers used attribute analytics to form teams.
Managers at a new India center couldn’t build a demographically diverse team, however: All the center’s engineers were roughly the same age, had similar backgrounds, and were about the same rank. So the manager instead chose engineers who had worked on projects with different offices and worked in different areas of the center—creating a team that naturally had a higher external range.
It so happened that such a team showed lower internal density as well. Its members felt free to debate, and they ran tests to resolve differences of opinion. Once they found a new procedure, they went back to their external connections, using them as influencers who could persuade others to validate their work.
After three years the India center’s team was producing more process innovations than any of the other teams. After five years it had generated almost twice as many as all the other teams combined. In response, the company began supplementing its attribute analytics with relational analytics to reconfigure the innovation teams at its other locations.
Silos
Everyone hates silos, but they’re natural and unavoidable. As organizations develop deep areas of expertise, almost inevitably functions, departments, and divisions become less and less able to work together. They don’t speak the same technical language or have the same goals.
Silo Signature
Focus: Organization
Predicts: Whether an organization is siloed
Each color indicates a department. People within the departments are deeply connected, but only one or two people in any department connect with people in other departments. The groups’ modularity—the ratio of internal to external communication—is high.
We assess the degree to which an organization is siloed by measuring its modularity. Most simply, modularity is the ratio of communication within a group to communication outside the group. When the ratio of internal to external communication is greater than 5:1, the group is detrimentally siloed.
One of the most strikingly siloed organizations we’ve encountered was a small not-for-profit consumer advocacy group, which wanted to understand why traffic on its website had declined. The 60 employees at its Chicago office were divided among four departments: business development, operations, marketing and PR, and finance. Typical of silos, each department had different ideas about what was going on.
Analysis showed that all four departments exceeded the 5:1 ratio of internal to external contacts. The most extreme case was operations, with a ratio of 13:1. Of course, operations was the department with its finger most squarely on the pulse of consumers who visited the site. It sat on a trove of data about when and why people came to the site to complain about or praise companies.
Other departments didn’t even know that operations collected that data. And operations didn’t know that other departments might find it useful.
To fix the problem, the organization asked specific employees in each department to become liaisons. They instituted a weekly meeting at which managers from all departments got together to talk about their work. Each meeting was themed, so lower-level employees whose work related to the theme also were brought into the discussions.
In short, the not-for-profit engineered higher external range into its staff. As a result, operations learned that marketing and PR could make hay out of findings that linked a growing volume of complaints in a specific industry to certain weather patterns and seasons. Because operations employees learned that such insights would be useful, they began to analyze their data in new ways.
Vulnerability
Although having people who can help move information and insights from one part of the organization to another is healthy, an overreliance on those individuals can make a company vulnerable.
Vulnerability Signature
Focus: Organization
Predicts: Which employees the organization can’t afford to lose
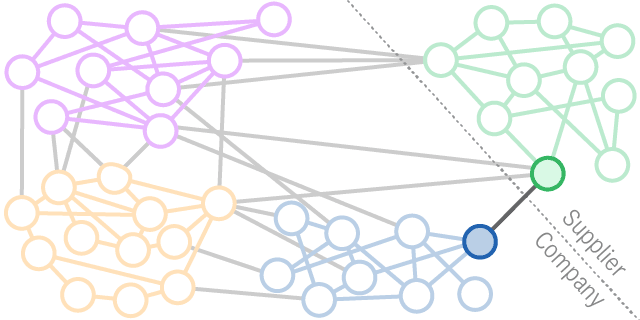
Green is a critical external supplier to company departments blue, purple, and orange. Six people at the company have relationships with green, but 30 people rely on those relationships—which puts the company at risk. If blue’s one connection to green leaves, for example, the department will be cut off from the supplier. While his title may not reflect his importance, that employee is vital to information flow.
Take the case of an employee we’ll call Arvind, who was a manager in the packaging division at one of the world’s top consumer goods companies. He was a connector who bridged several divisions. He talked regularly with counterparts and suppliers across the world. But on the organizational chart, Arvind was nobody special: just a midlevel manager who was good at his job. Companies are at risk of losing employees like Arvind because no obvious attribute signals their importance, so firms don’t know what they’ve got until it’s gone.
Without Arvind, the packaging division would lack robustness. Networks are robust when connections can be maintained if you remove nodes—employees—from it. In this case, if Arvind left the company, some departments would lose all connection with other departments and with suppliers.
It wasn’t that Arvind was irreplaceable. He just wasn’t backed up. The company didn’t realize that no other nodes were making the necessary network connections he provided. That made it vulnerable: If Arvind was out sick or on vacation, work slowed. If Arvind decided that he didn’t like one of the suppliers and stopped interacting with it, work slowed. And if Arvind had too much on his plate and couldn’t keep up with his many connections, work also slowed.
It wasn’t that Arvind was irreplaceable. He just wasn’t backed up.
On the day Noshir came to show the company this vulnerability in the packaging division, he entered a boardroom filled with cakes and sweets. A senior executive happily told him that the firm was throwing a party for Arvind. He was retiring. Noshir’s jaw dropped. The party went on, but after learning how important Arvind was, the company worked out a deal to retain him for several more years and, in the meantime, used relational analytics to do some succession planning so that multiple people could take on his role.
Capture Your Company’s Digital Exhaust
Once you understand the six structural signatures that form the basis of relational analytics, it’s relatively easy to act on the insights they provide. Often, the fixes they suggest aren’t complex: Set up cross-functional meetings, enable influential people, retain your Arvinds.
Why, then, don’t most companies use relational analytics for performance management? There are two reasons. The first is that many network analyses companies do are little more than pretty pictures of nodes and edges. They don’t identify the patterns that predict performance.
The second reason is that most organizations don’t have information systems in place to capture relational data. But all companies do have a crucial hidden resource: their digital exhaust—the logs, e-trails, and contents of everyday digital activity. Every time employees send one another e-mails in Outlook, message one another on Slack, like posts on Facebook’s Workplace, form teams in Microsoft Teams, or assign people to project milestones in Trello, the platforms record the interactions. This information can be used to construct views of employee, team, and organizational networks in which you can pick out the structural signatures we’ve discussed.
For several years we’ve been developing a dashboard that captures digital exhaust in real time from these various platforms and uses relational analytics to help managers find the right employees for tasks, staff teams for efficiency and innovation, and identify areas in the organization that are siloed and vulnerable to turnover. Here are some of the things we’ve learned in the process:
Passive collection is easier on employees.
To gather relational data, companies typically survey employees about whom they interact with. Surveys take time, however, and the answers can vary in accuracy (some employees are just guessing). Also, to be truly useful, relational data must come from everyone at the company, not just a few people. As an executive at a large financial services company told us, “If I gave each of my 15,000 employees a survey that takes half an hour to do, we’ve just lost a million dollars in productivity. And what if their relationships change in a month? Will we have to do it again at a cost of an additional $1 million in people hours?”
Company-collected relational data, however, creates new challenges. Although most employment contracts give firms the right to record and monitor activities conducted on company systems, some employees feel that the passive collection of relational data is an invasion of privacy. This is not a trivial concern. Companies need clear HR policies about the gathering and analysis of digital exhaust that help employees understand and feel comfortable with it.
What About Employee Privacy?
Relational analytics changes the equation when it comes to the privacy of employee data. When employees actively …
Behavioral data is a better reflection of reality.
As we’ve noted, digital exhaust is less biased than data collected through surveys. For instance, in surveys people may list connections they think they’re supposed to interact with, rather than those they actually do interact with. And because every employee will be on at least several communication platforms, companies can map networks representing the entire workforce, which makes the analysis more accurate.
Also, not all behaviors are equal. Liking someone’s post is different from working on a team with someone for two years. Copying someone on an e-mail does not indicate a strong relationship. How all those individual behaviors are weighted and combined matters. This is where machine-learning algorithms and simulation models are helpful. With a little technical know-how (and with an understanding of which structural signatures predict what performance outcomes), setting up those systems is not hard to do.
Constant updating is required.
Relationships are dynamic. People and projects come and go. To be useful, relational data must be timely. Using digital exhaust in a relational analytics model addresses that need.
Additionally, collecting relational data over time gives analysts more choices about what to examine. For example, if an employee was out on maternity leave for several months, an analyst can exclude that time period from the data or decide to aggregate a larger swath of data. If a company was acquired in a particular year, an analyst can compare relational data from before and after the deal to chart how the company’s vulnerabilities may have changed.
Analyses need to be close to decision makers.
Most companies rely on data scientists to cull insights related to talent and performance management. That often creates a bottleneck, because there aren’t enough data scientists to address all management queries in a timely manner. Plus, data scientists don’t know the employees they are running analyses on, so they cannot put results into context.
Dashboards are key.
A system that identifies structural signatures and highlights them visually moves analytic insights closer to the managers who need them. As one executive at a semiconductor chip firm told us, “I want my managers to have the data to make good decisions about how to use their employees. And I want them to be able to do it when those decision points happen, not later.”
CONCLUSION
People analytics is a new way to make evidence-based decisions that improve organizations. But in these early days, most companies have been focused on the attributes of individuals, rather than on their relationships with other employees. Looking at attributes will take firms only so far. If they harness relational analytics, however, they can estimate the likelihood that an employee, a team, or an entire organization will achieve a performance goal. They can also use algorithms to tailor staff assignments to changes in employee networks or to a particular managerial need. The best firms, of course, will use relational analytics to augment their own decision criteria and build healthier, happier, and more-productive organizations.